Bollinger band with python
25 Jun 2021Bollinger Band (BB)
The bollinnger band is mening of standard deviation with calculation of moving average during 20, 60, and 120.
It has been known to have tendecy narrow to wide and wide to narrow again.
Additionally, If price of stock is over the line by BB, It has tendecy to be upper the line and If this is under the linne by BB, It has tendecu to be lower.
This is presented with price of stock and moving average line with Python.
It is needed to be downlaod on the web site. We have very useful method using pandas_datareader API.
pip install pandas-datareader
Class code
Anyway, the code of class is below.
# classBB.py
import pandas as pd
import pandas_datareader as pdr
import datetime

class Stocks:
		 def __init__(self, symbol, start_day, end_day, url = '', Offline=False):
         self.symbol = symbol
         self.start_day = start_day
         self.end_day = end_day
         self.url = url
         self.Offline = Offline

     def get_price_data(self):
         if (self.Offline == True):
             url_price = self.url+'/FS_{0}_Value.json'.format('sp500') # If you have nasdaq stocks, you'd like to choose  nasdaq stocks rather than sp500 or dow to have many data sets
             combined_price = pd.read_json(url_price)
             df = combined_price[combined_price.Ticker.str.contains(self.symbol)]
             df_price = df.copy()
             df_price = df_price.set_index('Date')
             df_price = df_price.drop(['Ticker'], axis=1)
             df_price = df_price.loc[self.start_day : self.end_day]

         else:
             df_price = pdr.DataReader(self.symbol, 'yahoo',self.start_day, self.end_day)

         return df_price

     def with_moving_ave(self):
         df_price = self.get_price_data()
         ma5= df_price['Adj Close'].rolling(window = 5, min_periods=1).mean()
         ma20= df_price['Adj Close'].rolling(window = 20, min_periods=1).mean()
         ma60= df_price['Adj Close'].rolling(window = 60, min_periods=1).mean()
         ma120= df_price['Adj Close'].rolling(window = 120, min_periods=1).mean()
         std = df_price['Adj Close'].rolling(window = 20, min_periods=1).std()
         bol_upper = ma20 + 2*std
         bol_down = ma20 - 2*std

         df_price.insert(len(df_price.columns), 'MA5', ma5)
         df_price.insert(len(df_price.columns), 'MA20', ma20)
         df_price.insert(len(df_price.columns), 'MA60', ma60)
         df_price.insert(len(df_price.columns), 'MA120', ma120)
         df_price.insert(len(df_price.columns), 'Std', std)
         df_price.insert(len(df_price.columns), 'bol_upper', bol_upper)
         df_price.insert(len(df_price.columns), 'bol_down', bol_down)

         return df_price
The function get_price_data() is meaning to be download for online by yahoo finance for real time and another method to be analyzied for offline by local after download the same method. It is explaind later :)
Main Code of Ploting
# PlotBB.py

import pandas_datareader as pdr
import pandas as pd
import matplotlib.pyplot as plt
import matplotlib.ticker as ticker
from matplotlib import gridspec
from mplfinance.original_flavor import candlestick2_ohlc

import datetime

from classBB import Stocks

def main():
    td_1y = datetime.timedelta(weeks=52/2)
    #start_day = datetime.datetime(2019,1,1)
    #end_day = datetime.datetime(2021,5,1)
    today = datetime.datetime.now()
    start_day = today - td_1y

    # To test just a ticker for making class
    symbol = input('Write ticker name like AAPL: ')
    url_data = '/Users/hanseopark/Work/stock/data_origin/'

    offline_test = False
    stock = Stocks(symbol, start_day, today, url=url_data, Offline= offline_test)

    ## For figure
    df = stock.with_moving_ave()
    index = df.index.astype('str')
    fig = plt.figure(figsize=(10,10))

    gs = gridspec.GridSpec(2,1,height_ratios=[3,1])
    ax_main = plt.subplot(gs[0])
    ax_1 = plt.subplot(gs[1])

    def x_date(x,pos):
        try:
            return index[int(x-0.5)][:7]
        except IndexError:
            return ''
    # ax_main
    ax_main.xaxis.set_major_locator(ticker.MaxNLocator(10))
    ax_main.xaxis.set_major_formatter(ticker.FuncFormatter(x_date))

    ax_main.set_title(symbol+' stock', fontsize=22 )
    #ax_main.set_xlabel('Date')
    ax_main.plot(index, df['MA5'], label='MA5')
    ax_main.plot(index, df['MA20'], label='MA20')
    ax_main.plot(index, df['MA60'], label='MA60')
    ax_main.plot(index, df['MA120'], label='MA120')
    ax_main.plot(index, df['bol_upper'], label='bol_upper')
    ax_main.plot(index, df['bol_down'], label='bol_down')
    ax_main.fill_between(index, df['bol_down'], df['bol_upper'], color = 'gray')

    candlestick2_ohlc(ax_main,df['Open'],df['High'],df['Low'],df['Close'], width=0.5, colorup='r', colordown='b')

    ax_main.legend(loc=2)

    # ax_1
    ax_1.xaxis.set_major_locator(ticker.MaxNLocator(10))
    ax_1.xaxis.set_major_formatter(ticker.FuncFormatter(x_date))
    ax_1.set_xlabel('Date')
    ax_1.set_ylabel('Std')
    ax_1.plot(index, df['Std'], label='Std')
    mean = df['Std'].mean()
    ax_1.hlines(y=mean, xmin=index[0], xmax=index[-1], colors='red')

    plt.grid()
    plt.show()

if __name__ == '__main__':
     main()
To be choice from start day to end day and if it checks offline test or not
For figure, using gridspec to be seperated canvas and candlestick2_ohlc that has advatage to make candlestick plot easily.
Any other plot library is easily explaind by google :) just search.
Example figure
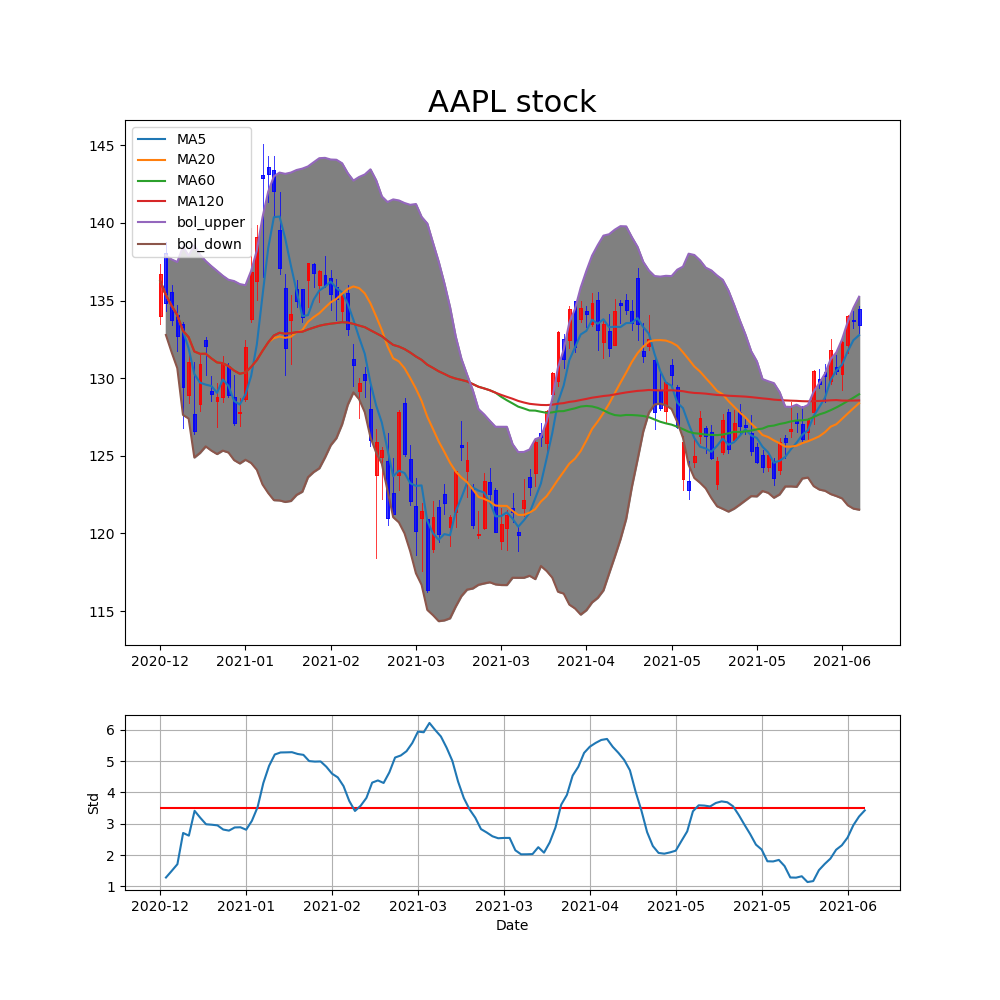
Typical ticker is AAPL(Apple). upper figure is presented price with BB and down figure is presented by only standard deviation at 2021-06-25.
Model, Selection
For using Bolliner band, we can make model and select ticker in index (Dow, S&P500 etc)?
I have simple idea to use standard deviation with recent price and prior to price.
- Is it true currunt standard deviation over mean of standard deviation during period?
- It is true recent price below upper line of BB?
- Is it true this ticker is rising?
- price of today over price of yesterday
- price of yesterday over price of the day befor yesterday
If upper the condition is satisfied, I think that selected ticker has high probabily of rising to be future.
In my case I make the code for modeling and selection below.
To download index using yahoo_fin API. This is very useful to download price, financial statements and others.
pip install yahoo-fin
# modelBB.py
import pandas as pd
import yahoo_fin.stock_info as yfs

import datetime
from tqdm import tqdm

from classBB import Stocks

def main(stock_list, day_init=datetime.datetime(2020,1,1), today=datetime.datetime.now()):

   # Get list of Dow tickers
    dow_list = yfs.tickers_dow()
    filename = ''
    if stock_list == 'dow':
        dow_list = yfs.tickers_dow()
        filename = 'dow'
    elif stock_list == 'sp500':
        filename = 'sp500'
        dow_list = yfs.tickers_sp500()
    elif stock_list == 'nasdaq':
        filename = 'nasdaq'
        dow_list = yfs.tickers_nasdaq()
    elif stock_list == 'other':
        filename = 'other'
        dow_list = yfs.tickers_other()
    print(dow_list)

    selected_ticker = []
    for ticker in tqdm(dow_list):

        stock = Stocks(ticker, start_day, today)
        df = stock.with_moving_ave()
        index = df.index.astype('str')
        mean = df['Std'].mean()
        df_day_ago_ago = df.iloc[-3]
        df_day_ago = df.iloc[-2]
        df_recent = df.iloc[-1:]
        #print(df_day_ago)
        #print(df_recent)
        value_day_ago_ago = float(df_day_ago_ago['Adj Close'])
        value_day_ago = float(df_day_ago['Adj Close'])
        value_recent = float(df_recent['Adj Close'])
        upper_recent = float(df_recent['bol_upper'])
        down_recent = float(df_recent['bol_down'])
        std_recent = float(df_recent['Std'])

        if std_recent < mean and value_recent > value_day_ago and value_day_ago > value_day_ago_ago and value_recent <   upper_recent:
            selected_ticker.append(ticker)

    url = '/Users/hanseopark/Work/stock/data_ForTrading/{0}_TickerList'.format(today.date())
    df = pd.DataFrame(selected_ticker, columns=['Ticker'])
    #df.columns = ['Ticker']
    df.to_json(url+'json')
    df.to_csv(url+'csv')

    print(df)
    return df

if __name__ == '__main__':
    s_list= input("Choice of stock's list (dow, sp500, nasdaq, other): ")
    td_1y = datetime.timedelta(weeks=52/2)
    #start_day = datetime.datetime(2019,1,1)
    today = datetime.datetime.now()
    start_day = today - td_1y

    main(stock_list = s_list,day_init = start_day)
Conclusion
Let us know what is BB (Bollinger Band) and how to calculate with figure. And then we are going to find ticekr using this model.
If you want to use this code, I’m very sorry that you should change code and make directory for data a little bit.
I should appreciate and refer for many blog on google. Thanks a lot.
If you satisfied this post you should check Github and please Star :)